Jack Mead
import cv2
from matplotlib import pyplot as plt
import numpy as np
Kona Coffee Yield Identification
Introduction
I’m not that much of a coffee guy, but can appreciate a good cup of coffee. I’ve traveled to Columbia and had some pretty amazing local coffee. Had some pretty good local coffee grown in the hilly north of Thailand. And just generally have had a preference to more expensive coffee. Kona coffee is right up there with some of the best coffee I’ve had.
While touring a coffee farm in Kona, Hawaii, I was amazed at just how simple the strategies of growing, harvesting, and processing the coffee is. The business is very local and the growers take pride in their craft. Very little science is conducted to phenotype or develop resistant varieties. A lot of coffee farms are also organic providing very little yield in comparison.
However, there is a very real threat to the industry that only recently made it’s way to the island. It was only in 2010 that the coffee berry borer was discovered in Kona. And in 2020, the coffee leaf rust was discovered. These combined are the most impactful threat in the coffee industry itself! I wondered if I might be able to utilize technology to help the growers in Kona, while ensuring that the coffee industry remains sustainable. Something that helps the growers do what they do best instead of taking their jobs away.
Overview
In the mountainous region of Kona, Hawaii, United States on the slopes of Hualalai mountain, some of the world’s best coffee is grown. Only a few farmers in the area are allowed to grow it to be considered “Kona” coffee and have to follow strict guidelines to preserve the quality and taste. However, the industry has been met with difficulties in recent years. The most economically important coffee pest worldwide, the Coffee berry borer, was first identified on the big island in 2010. In recent years, the coffee leaf rust (CLR) disease was detected on the islands in 2020 and poses serious risk to the industry. What if recent advances in open sourced artificial intelligence and computer vision could help? With the latest innovation in the computer vision space, semantic segmentation has become easier than ever. Not only are automatically generated masks much easier to produce, but training has become a lot more convenient. With the right dataset, very powerful machine vision models can be produced to detect nearly any object within video and images.
If a dataset could be collected that identifies leaves and coffee berries within video or images, then a machine vision model could be produced to identify them. In an economical sense, if the model could produce an estimated count of the total amount of berries, and classify them by their lifecycle, farmers could have more information about their yields and plan harvesting schedules with more precision. Additionally, if the model could estimate the spread of the berry borers or leaf rust, growers may be able to save money by applying herbicide and pesticide only to affected locations. Academically, researchers could accelerate their data collection which may otherwise have been a manual process. Furthermore, researchers may have a more advanced tool to perform phenotyping by analyzing the visual characteristics of the berries or leaves.
Goals
Identify individual berries on any given tree by utilizing semantic segmentation and classify them by lifecycle (color).
Identify and classify leaves with leaf rust on any given tree
Stretch goal: Identify and classify berries that have become infected with the berry borer
Deliverables
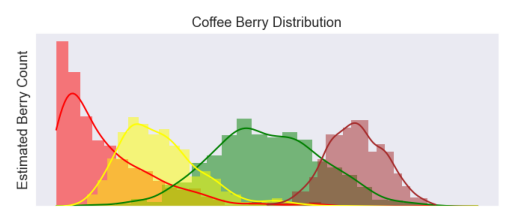
Produce histograms of berries showing the distribution of each category. This will show how the berry populations may be skewed one way over the other or simply to know how much of the population is in each category. In addition, within a single population, the skew may lead to further inquiries. For example: if there are many red berries concentrated towards one end, then berries may be tending to over ripen and start turning brown. On the other end, berries may be just starting to ripen.
plt.axis('off')
plt.imshow(cv2.imread('distribution.png')[:,:,::-1])
<matplotlib.image.AxesImage at 0x7f71996d97b0>
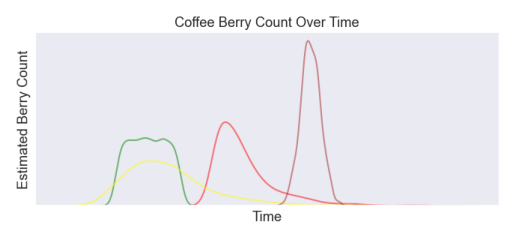
Produce historical graphs showing each category of berry over time. This defines a graph overtime that can show how plants are developing and can be used to project yields and estimated dates of harvesting by projecting growth rates into the future. If data is overlaid with geographical location of the farm, this may show how some fields may be better performing than others.
plt.axis('off')
plt.imshow(cv2.imread('count.png')[:,:,::-1])
<matplotlib.image.AxesImage at 0x7f719844fca0>
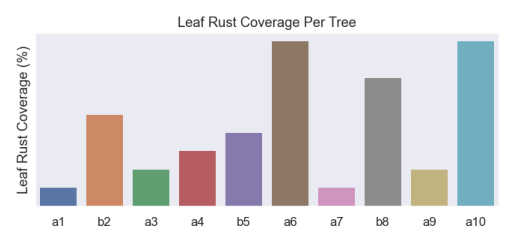
Produce bar charts showing leaf rust spread per tree sampled. Not only will this show total coverage of the disease, but if location data is overlaid it may also reveal how much it has spread.
plt.axis('off')
plt.imshow(cv2.imread('leaf_rust.png')[:,:,::-1])
<matplotlib.image.AxesImage at 0x7f7145928730>
Data Collection
Tree Selection
A selected number of trees will be chosen for monitoring that are distributed throughout an area within the field. The species or variety of the trees will be identified and given an identification number to be used as a reference over the project. For the purposes of getting photographs of berries as they continue growing past harvest and fall from the tree, it would be preferable to leave the trees unharvested. This will help in identifying ripe and over-ripe berries giving the dataset all the possible different lifecycle stages of the berries. However, this discretion will be left up to the management.
Image Collection
Depending on the growth stage of the berries, at least every two weeks, each tree will be photographed from two vantage points as a series of RAW images stitched into a panoramic view. If the berries are ripening to the point of harvest time, at least once a week photographs will be taken.
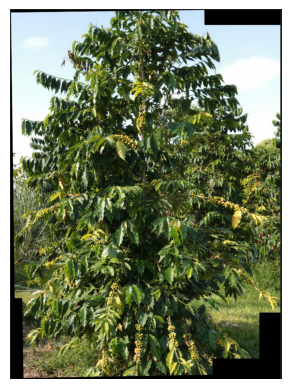
With the initial test sample collected (see below), the DLSR camera that was used produced a 50MB image after it was stitched together. But when zoomed in, the clarity was high enough to see even a small coffee berry!
plt.axis('off')
plt.imshow(cv2.imread('panorama.png')[:,:,::-1])
<matplotlib.image.AxesImage at 0x7f7144772470>
Future Data Collection
It would be very interesting to install a weather station in the field or collect harvesting, weeding, treatment schedules. These data sources may provide coorelation metrics to show the performance of the field over time. However, due to the limited scope of this project, I want to focus on the image data collection and analysis soley.
Conclusion
This is a fasinating project to work on. Having been in the agriculture section of software engineering for most of my career, I’ve been able to understand a lot of the business aspect. With this project, I may be able to create a valuable, open-sourced tool, that can help the industry and local farmers in my community. All the while, making a really cool project that I can be proud of.